- Published on
Setup DOM Break Point
Introduction
In the world of web development, debugging is an essential skill that can drastically improve the efficiency and functionality of your applications. One powerful tool in the debugging arsenal is the DOM (Document Object Model) breakpoint. This guide will walk you through setting a DOM breakpoint, explain its importance, and provide tips to maximize its use.
What is a DOM Breakpoint?
A DOM breakpoint is a debugging tool used in web browsers that allows developers to pause the execution of JavaScript when specific changes occur to the DOM. It's particularly useful for identifying and resolving issues related to dynamic content changes caused by JavaScript.
Why Use DOM Breakpoints?
- Error Identification: Quickly locate and fix errors that occur as a result of DOM manipulations.
- Understanding Code Flow: Gain insight into how and when your webpage's structure is modified by scripts.
- Performance Optimization: Identify redundant or inefficient DOM manipulations that could be optimized to enhance performance.
How to Set a DOM Breakpoint
- Open Developer Tools: In most browsers, you can access this by right-clicking on the webpage and selecting 'Inspect' or pressing Ctrl+Shift+I (Windows) or Cmd+Option+I (Mac).
- Navigate to the Elements Panel: Here, you can see the page’s HTML structure. Find the element on which you want to set the breakpoint.
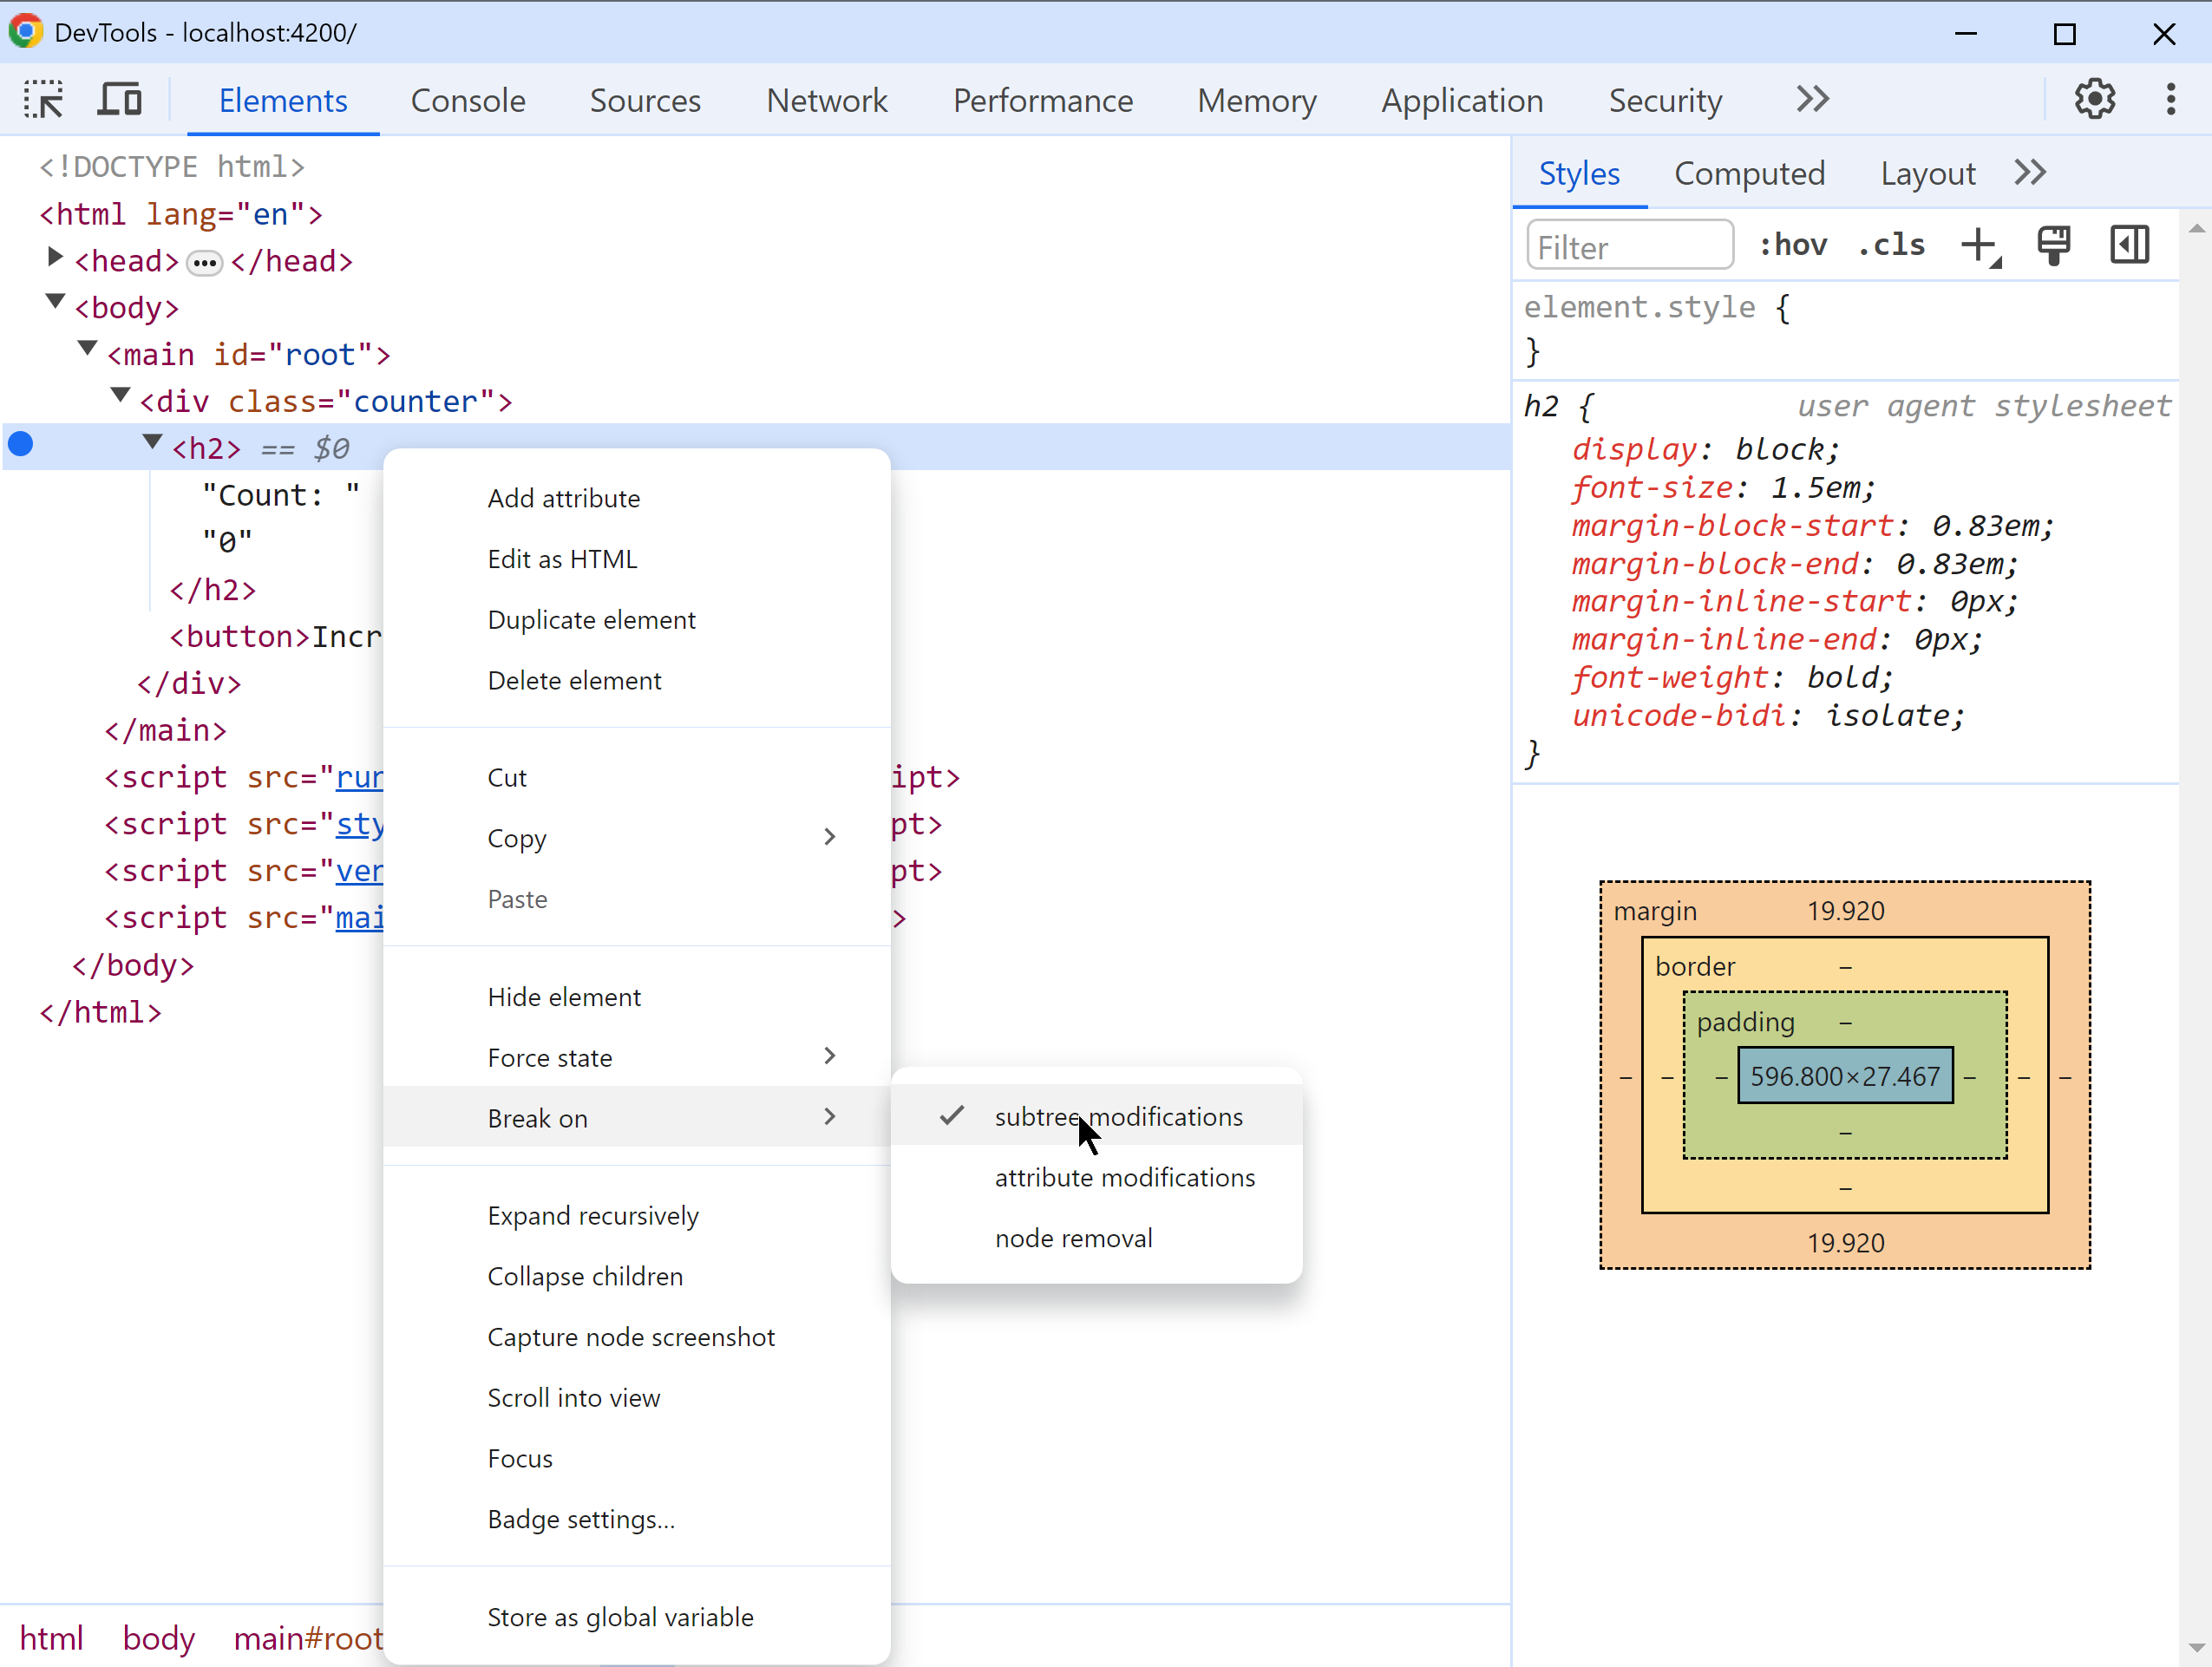
- Right-Click the Element: Choose 'Break on' and then select the type of operation that will trigger the breakpoint. You can choose from:
- Subtree modifications: Triggers if any child elements are added, removed, or modified.
- Attribute modifications: Triggers if an attribute of the selected element is added, changed, or removed.
- Node removal: Triggers if the selected node is removed from the DOM.
